
Systems Drag Index · methodology
The Systems Growth Map
The single most important visual in a Systems Drag Analysis™. It takes the five drag drivers – abstract by nature – and makes a business's operational state legible at a glance: where work flows, where it bottlenecks, and where the founder is carrying the system instead of the system carrying the work.
Workarounds, missing tools, and tool fragmentation create the five drag drivers, and those drivers become work the founder absorbs. The right tools and a connected operational layer create system-carried work that the founder oversees. Everything in the map exists to make that claim visible.
The map renders as three diagrams in sequence. The first is drawn from the reader's own tool audit – every line, ring, and colour set by what they told us about their stack. The second and third are the same structure resolved: the same target for every reader, because the diagnostic principles hold across businesses. Read in order, they are the journey from a drag-saturated present, to clean operations, to a system-led future. The reader doesn't have to imagine the work – they see it.
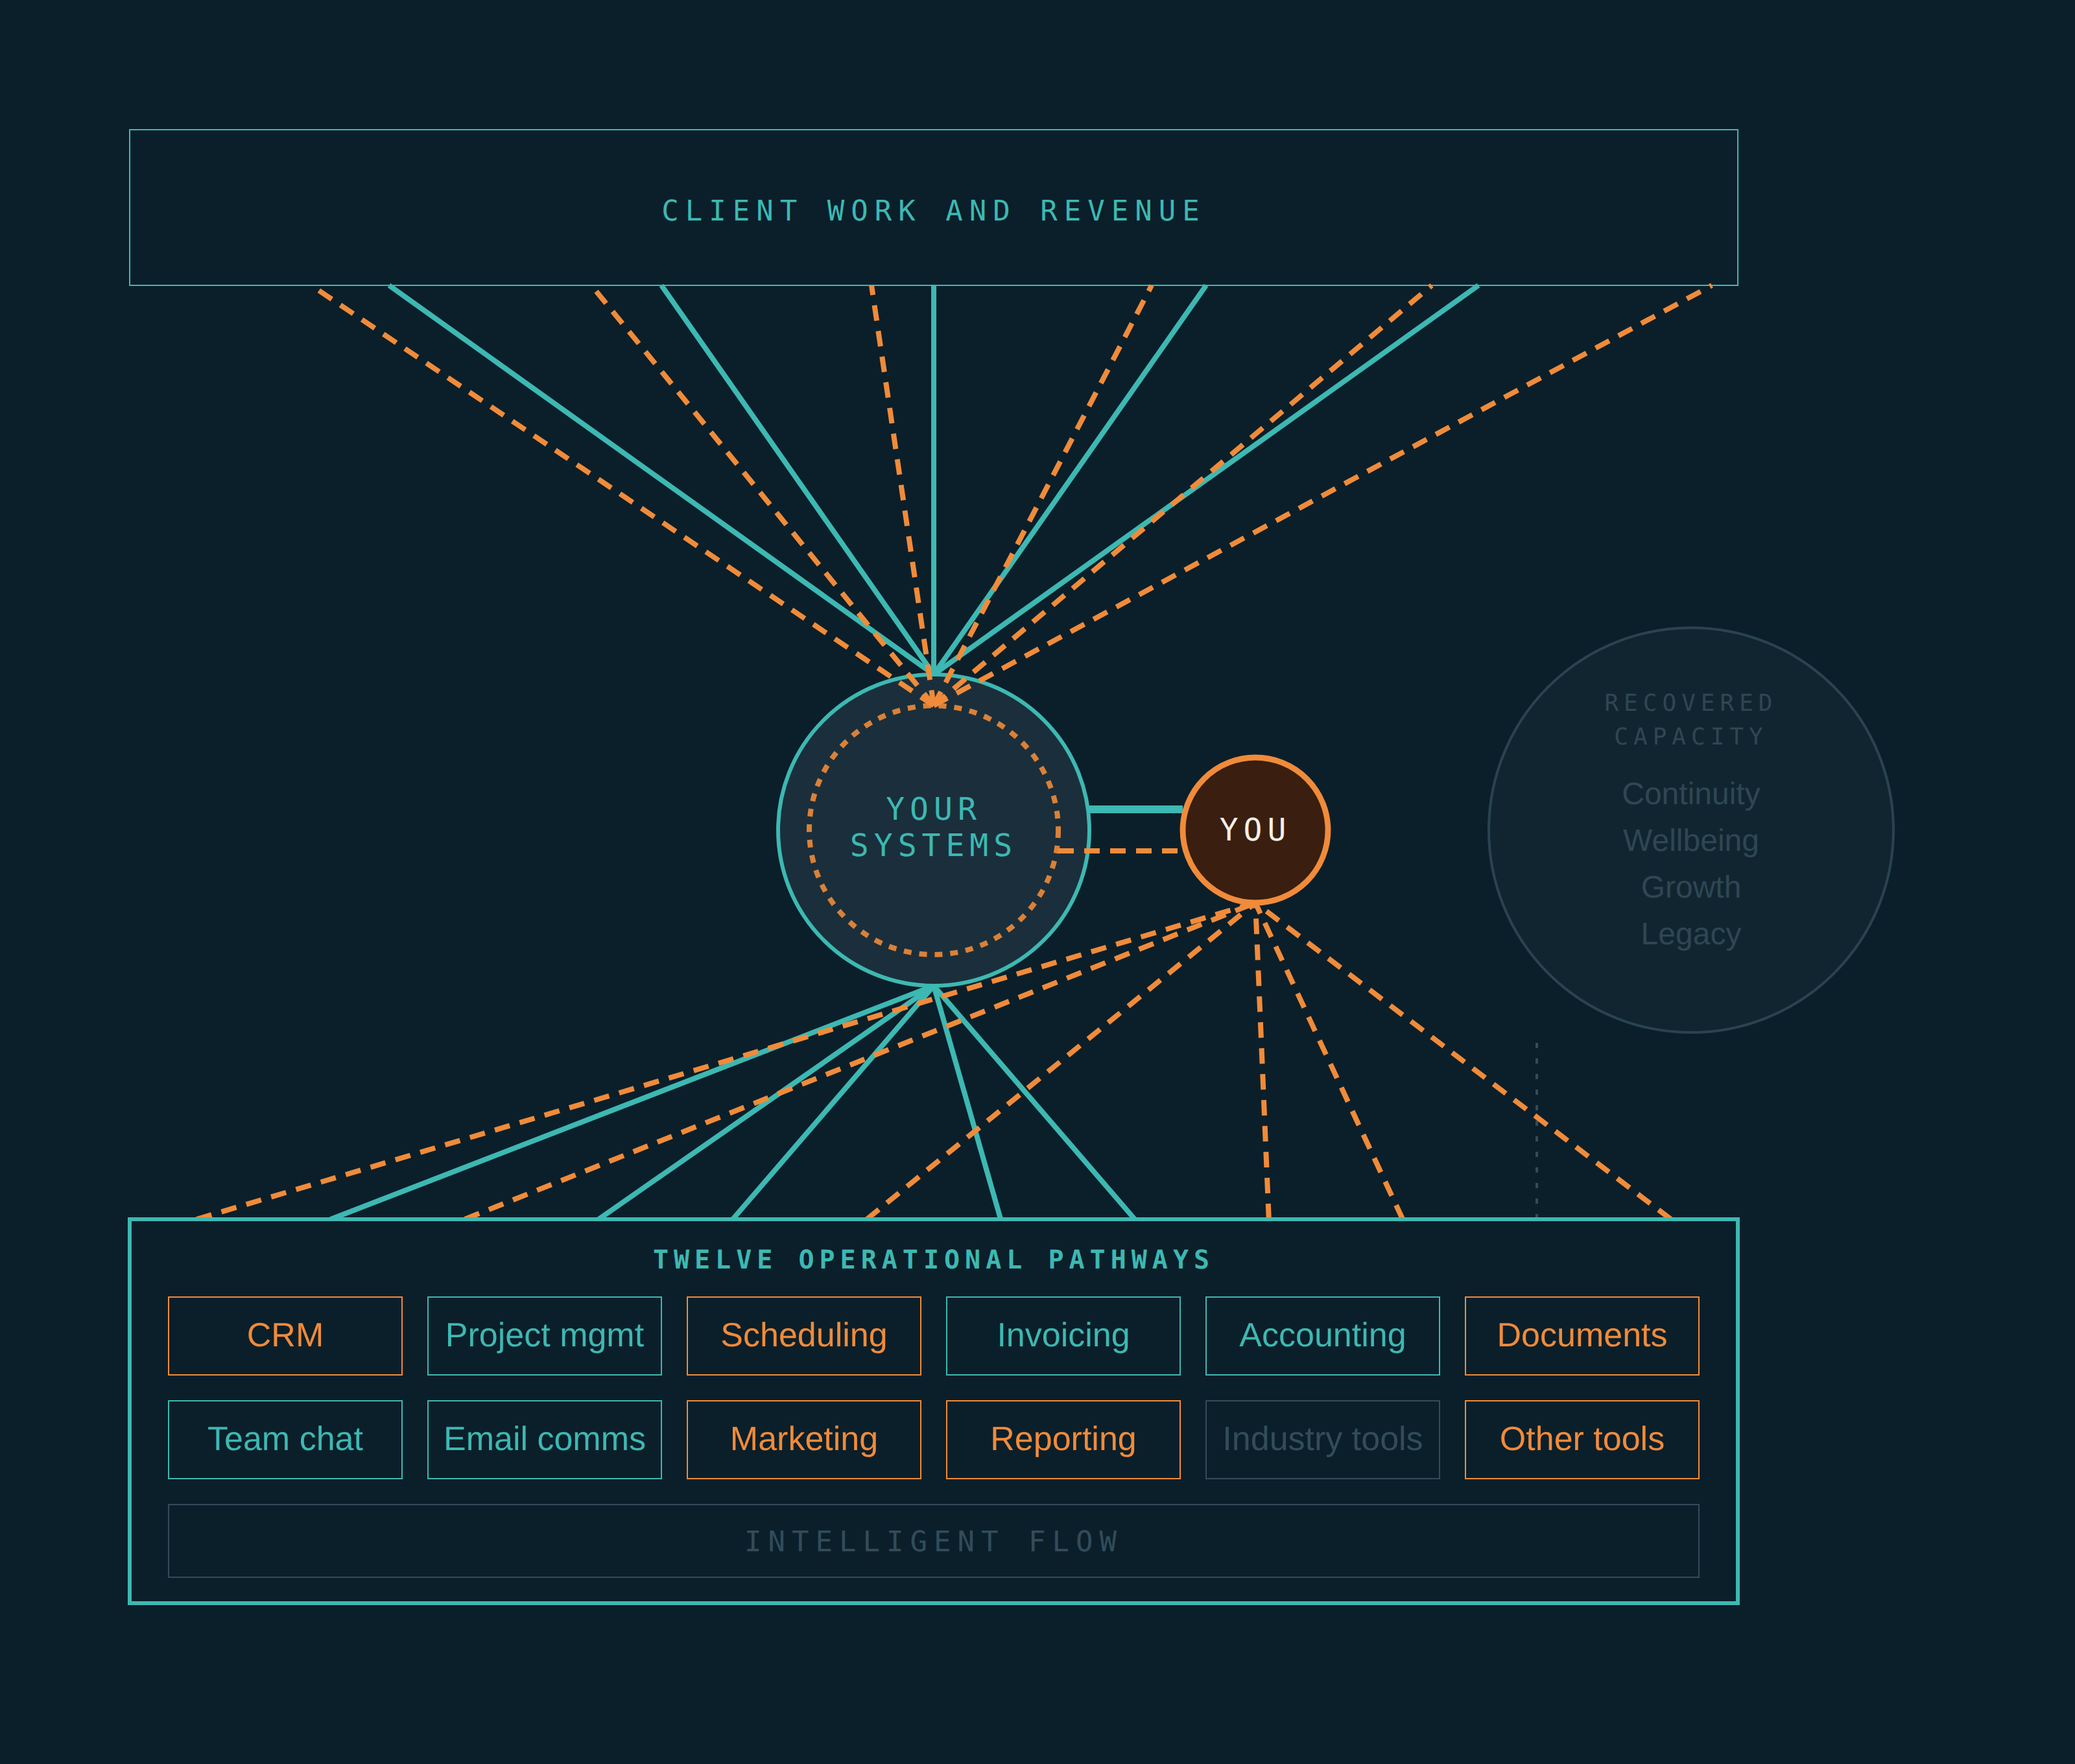
Your Current State
Data-driven. This is where the business is now – amber pathways where a workaround is carrying the load, an inner amber ring marking the drag drivers living inside the operational layer, and a YOU drawn heavy with what it's absorbing. The map doesn't soften the read.
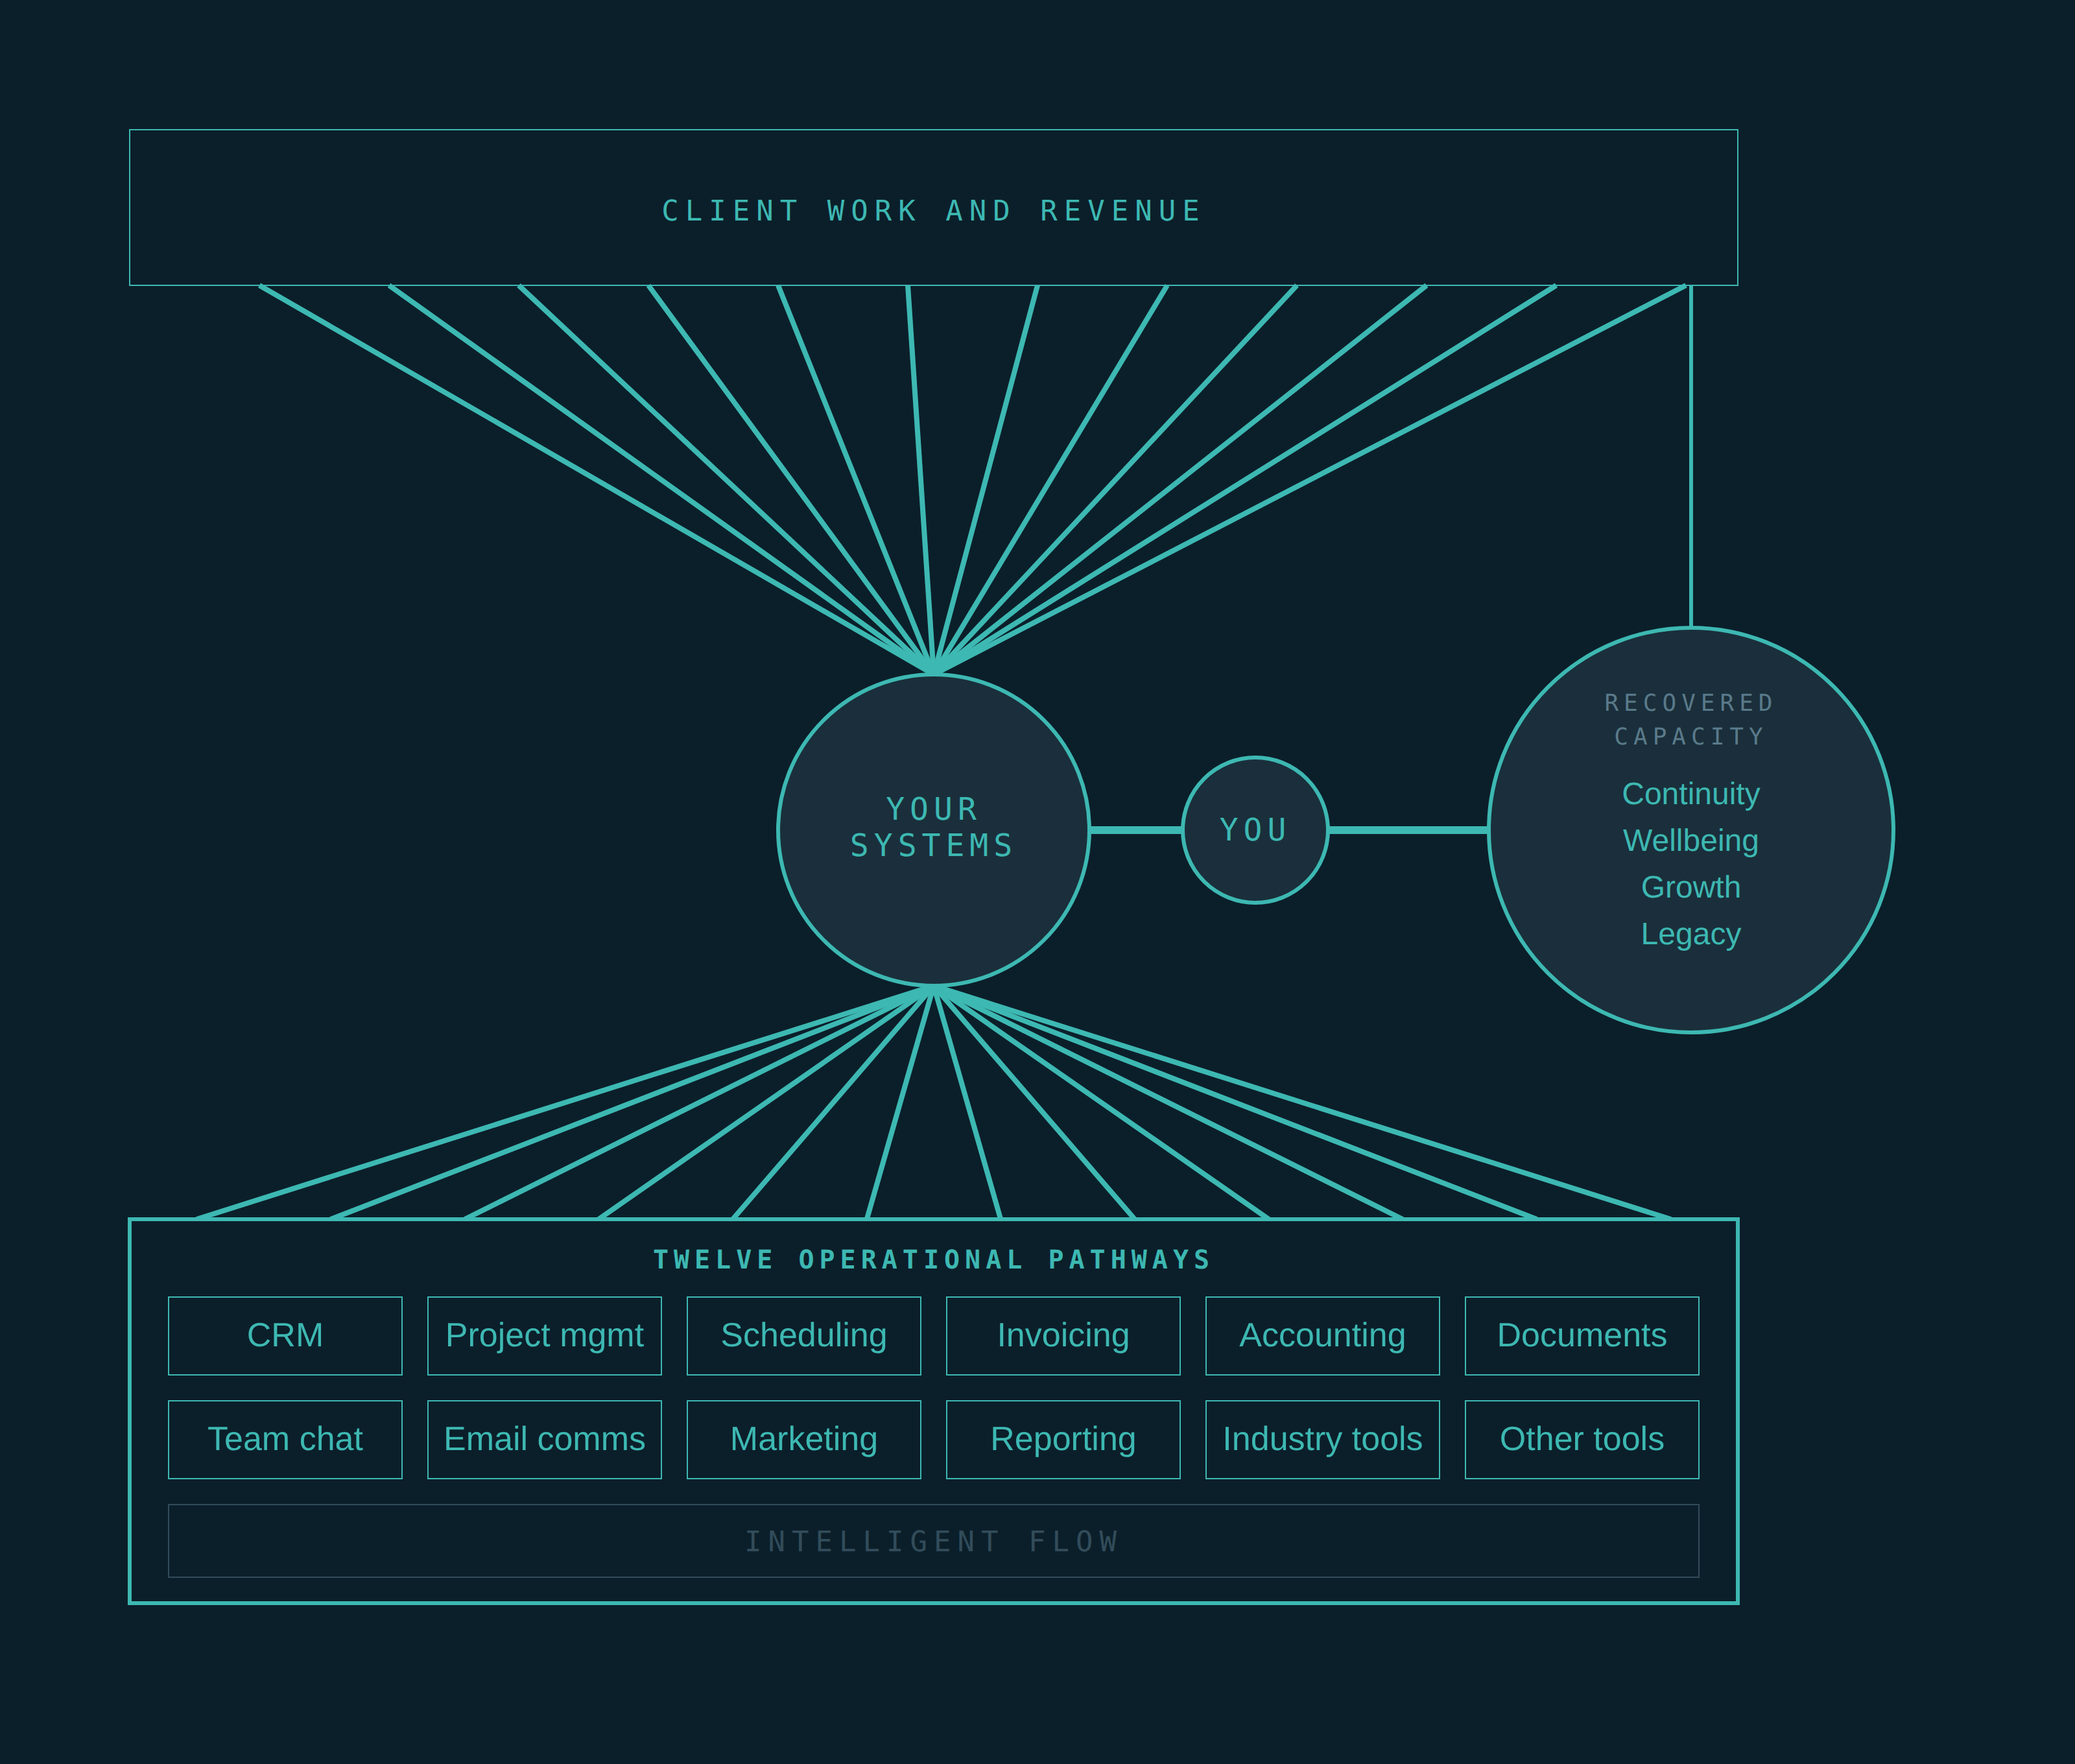
What Good Looks Like
The same structure, resolved. All twelve pathways teal, the inner ring gone, the founder positioned as overseer rather than operator. Recovered capacity is restored – drawn larger than the systems themselves, with a clean earned line carrying its contribution up to client work and revenue. Systems carry the work; the founder oversees.
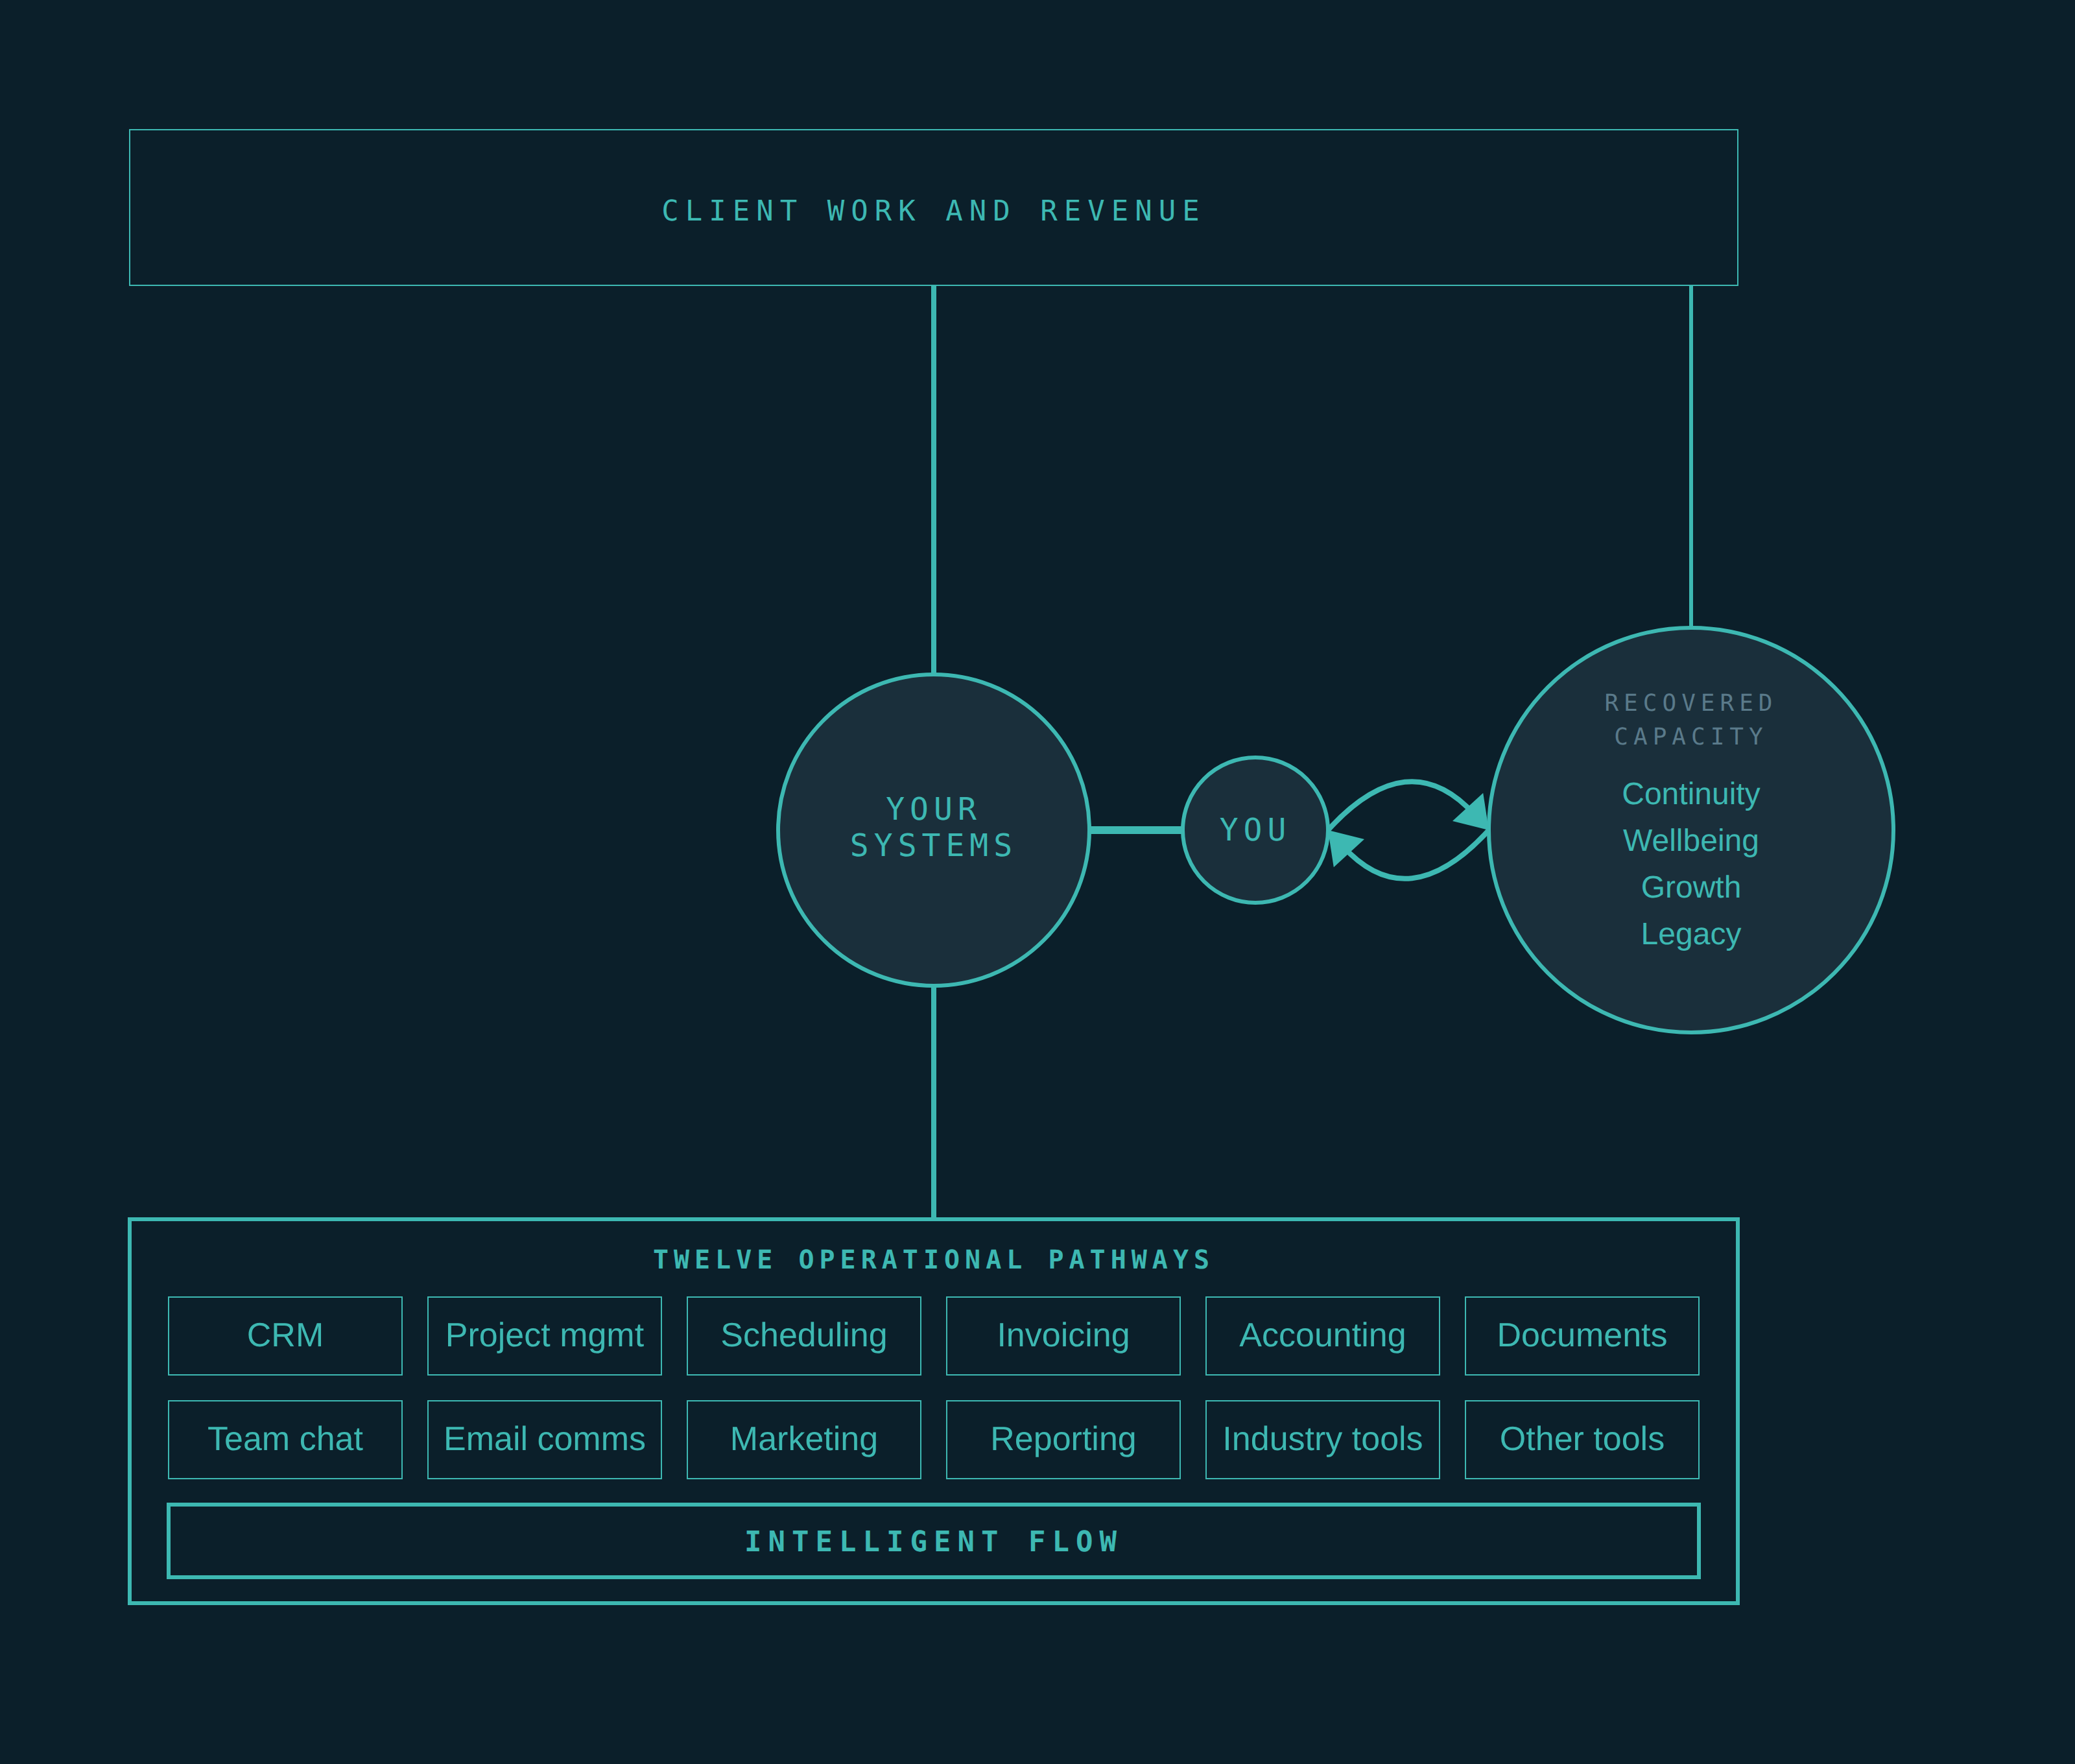
System-Led Operations
The further state. The Intelligent Flow strip turns bold teal – the connected operational layer is now doing real coordination, and the twelve separate pathways resolve into a single connected route. A calm regenerative loop joins the founder and their recovered capacity: the sustainable rhythm of a business that supports its operator. This is a journey, not a switch – not every reader needs to reach it.
Every pathway is coloured by its audit state. The reader can count the colours and read their own business in ten seconds – which functions are held by a real tool, which are being carried by a workaround, and which aren't getting done at all.
Teal – in place
An actual tool holds this function. Work flows into the system, and the system handles it.
Amber – workaround
A spreadsheet, an inbox, or memory is standing in. The work reaches output, but via the founder.
Grey – absent
Nothing is in place. The pathway trails off and reaches nowhere – work that isn't happening reliably.
The shape itself is the argument.
The map was designed against an alternative – a bullseye with the founder at the centre, rings of activity around them. That was rejected for a reason that goes to the heart of the diagnostic: it placed the founder at the centre of operations, which is exactly the position the Index argues against. A healthy operating system does not have the founder at its heart. The founder sits adjacent to it – overseeing, setting direction – with the work flowing through the system, not through them. A reader sees their own position on the map and understands, without being told, where they are meant to be.
One rule does quiet diagnostic work throughout: line conservation. The same number of lines leave as enter, per colour. Four pathways' worth of work still arrives at output whether it came through teal or through amber – the work gets done either way. The colour is the only thing that changes. The map shows the cost of how the work arrives without ever passing judgement on the person carrying it.
Your Systems
central · operational layerThe tools, processes, and connections that carry the work. Drawn as a circle, not a box – an organism work flows through, not a container. When workarounds exist, it holds an inner amber ring: the visible footprint of the drag drivers operating inside the layer.
You
founder · adjacentA smaller circle beside the systems, separated by a deliberate gap – the founder is adjacent to the operational layer, not inside it. It tints from quiet teal to heavy ember as workarounds accumulate. The weight is honest about what's being carried.
Recovered Capacity
outcome · enlargedDrawn larger than the systems on purpose: systems are support infrastructure, but restored human capacity is where long-term value is made. It holds the four outcomes the diagnostic measures – continuity, wellbeing, growth, legacy. Greyed in the current state, real once the workarounds resolve.
Intelligent Flow
connecting layerThe full-width strip at the foot of the pathway band – the coordination that links the pathways into one connected flow. Greyed until it's in place; bold teal in the system-led state, where it resolves the twelve pathways into a single consolidated route.
Client Work & Revenue
output · constantThe container at the top – what the business produces. Present in all three states in the same position. What changes is not whether the work arrives, but how it gets there.
The action library in the Analysis lists what to do. The Growth Map shows why – the action plan in visual form. It is held as a living methodology so the document and the artefact it describes can't drift apart.